
BCG Matrix
Star, Cow, or Dog? How to Decide Where Your Business Should Invest Next
EXECUTIVE SUMMARY:The Boston Consulting Group (BCG) Matrix is a portfolio management framework that helps organizations allocate resources and prioritize investments across their business units. It maps products on two dimensions: market growth rate and relative market share, categorizing them as Stars, Cash Cows, Question Marks, or Dogs. By clarifying which areas drive growth, generate cash, or consume resources, the BCG Matrix helps leaders balance short-term profitability with long-term strategic investment.In our recent article on the 2x2 Matrix, we explored how two simple variables can reveal powerful insights. We briefly mentioned the BCG Matrix, one of the most famous examples of this framework. In today’s deep dive, we will look more closely at what it is, where it came from, and how to use it to make smarter strategic decisions.
The BCG Matrix was developed in 1970 by Bruce Henderson, the founder of the Boston Consulting Group, as a tool to help large corporations allocate resources across multiple business units. Its core idea is that a company’s growth and profitability depend on maintaining a balanced portfolio of businesses: some that generate cash, and others that require it.
What is the BCG Matrix?
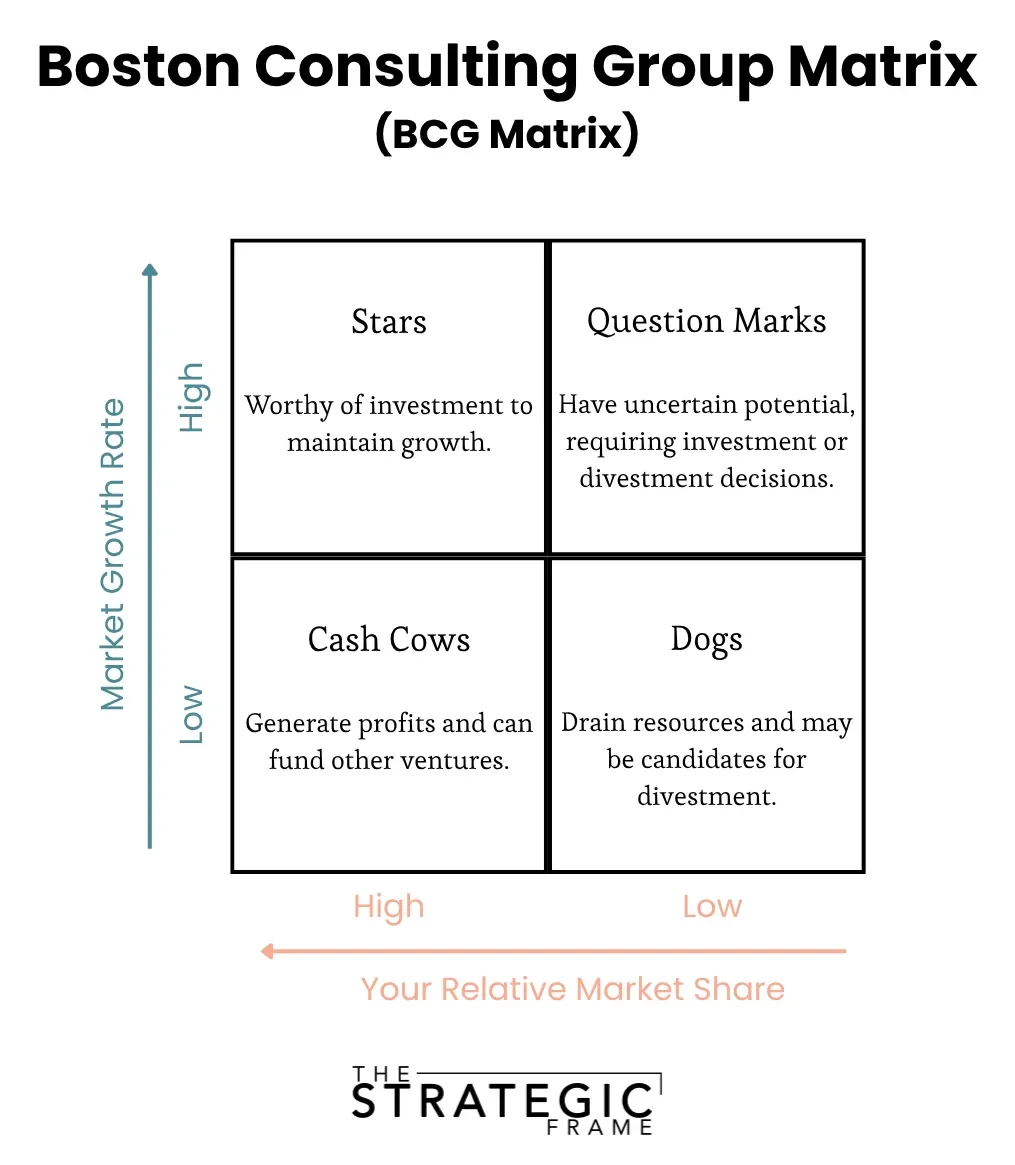
The BCG Matrix plots business units or products on two dimensions:
Market Growth Rate (vertical axis): how fast the market is expanding.
Relative Market Share (horizontal axis): how strong your position is compared to competitors.
From these axes, four quadrants emerge:
Stars: High growth and high market share. These are market leaders worthy of continued investment.
Cash Cows: Low growth and high market share. These generate reliable profits that can fund other ventures.
Question Marks: High growth and low market share. These have uncertain potential and require strategic decisions about whether to invest or divest.
Dogs: Low growth and low market share. These often drain resources and may be candidates for exit or repositioning.
How to Use the BCG Matrix in Practice
List your products or business units. Identify all offerings or divisions that contribute meaningfully to revenue or strategy.
Determine the market growth rate. Estimate how fast the market for each product is expanding.
Calculate relative market share. Compare your market share to your total competitive set, based on revenue.
Plot each business unit. With the data from steps 2 and 3, plot each offering on the matrix. You can also use bubble size to represent revenue or profit contribution for added context.
Define natural breaking points. Before labeling the quadrants, determine the thresholds that divide high and low values on each axis. These natural breakpoints may vary.
Develop a strategy for each quadrant.
Stars: Continue investing to maintain growth and leadership.
Cash Cows: Protect profitability and use surplus cash to fund future opportunities.
Question Marks: Decide whether to invest for growth or exit before losses mount.
Dogs: Limit spending and consider divestment or repositioning.
The goal is to maintain balance. Cash Cows fund Stars, and selected Question Marks can become the next generation of growth.
Tips for Getting the Most from the BCG Matrix
Use data, not intuition: Base market growth and share estimates on credible research.
Review periodically: Markets evolve, and positions shift. A Star today may become a Dog tomorrow.
Avoid oversimplification: The BCG Matrix is a starting point. Combine it with profitability, competitive advantage, or industry analysis.
Look for synergy: Some Dogs support Stars through shared capabilities or brand equity.
Wrapping It All Up
The BCG Matrix endures because it helps leaders see their business portfolio clearly. It transforms complexity into a visual snapshot that highlights balance, risk, and opportunity. When used thoughtfully, it guides resource allocation and strategic focus.
If you plotted your current products or projects on a BCG Matrix today, which quadrant would each fall into? What would that reveal about your future priorities?
This email is sponsored by Durable
Durable is Utah’s Business Commons — a community where business owners come together to build stronger companies. Through curated peer groups, private dinners, and meaningful events, they connect the people behind Utah’s businesses. Learn more at https://www.builddurable.co/.